Statistics South Africa released the results of the 2014/2015 Living Conditions Survey (LCS) conducted between October 2014 and October 2015 on 27 January 2017. The survey shows household incomes, consumption expenditure and it also informs poverty levels patterns which is due to be released later in 2017.
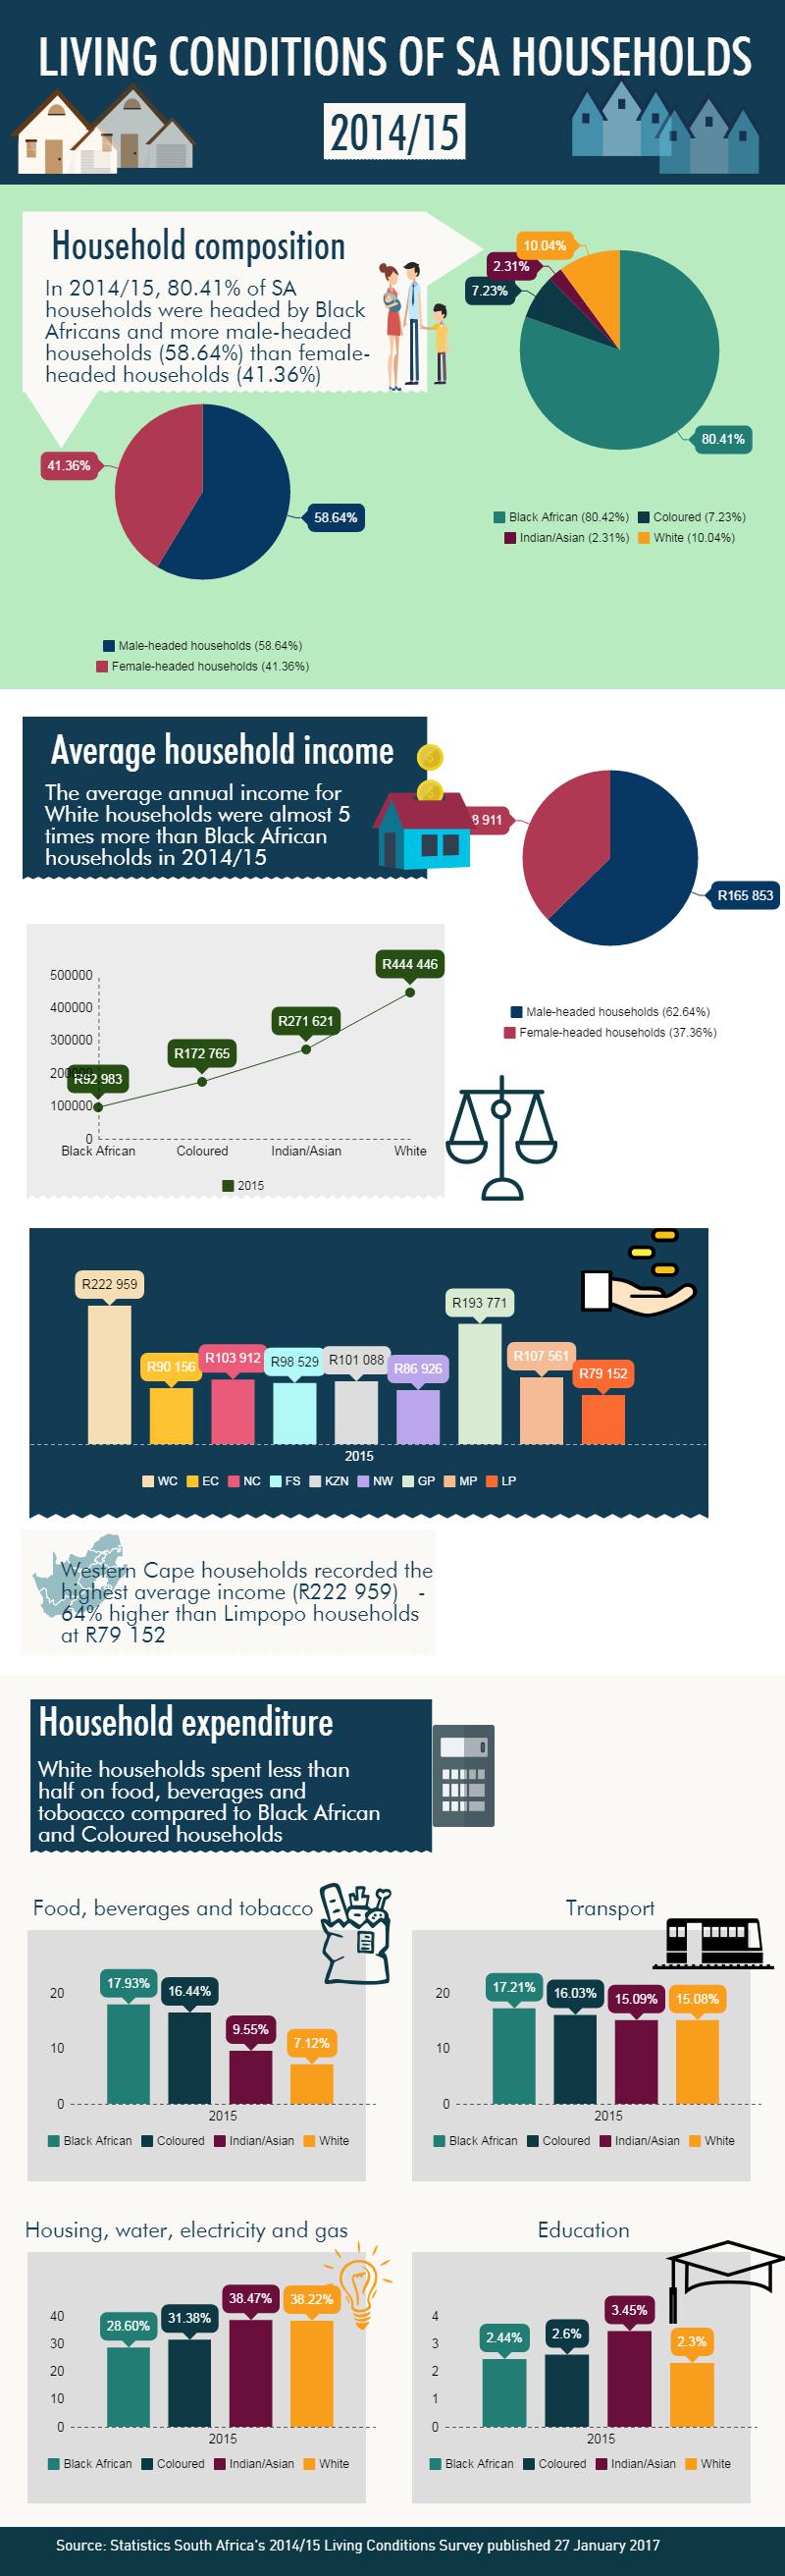
In 2015, eight out of ten households in South Africa were headed by black Africans (80,41%). Approximately a tenth of households were headed by whites (10,04%) and less than one in ten households were headed by coloureds (7,23%). Indian/Asian households only accounted for 2,31% and households headed by females totalled 41.36%.
Expenditure on housing, water, electricity, gas and other fuels accounted for the largest contribution (32,55%) of any of the main expenditure groups to total annual household consumption expenditure while 13,75% of total household consumption expenditure was on food, beverages and tobacco. Households in 2015 spent 21,43% more on communication (from 2,80% in 2011 to 3,40% in 2015), which could be the result of more access and use of Internet facilities.
Interesting outcomes of the survey showed the following:
- Each South African household spent R103 293 on average from October 2014 to October 2015
- White-headed households had an income roughly 4,5 times larger than black African-headed households and 3 times larger than the average national income
- Gauteng (R193 771) and Western Cape (R222 959) are the only provinces above the annual average national household income of R138 168
- South Africa spent on average R14 202 per annum on food, beverages and tobacco - 13,75% of total household consumption expenditure
See infographic below for more on living conditions of SA households:

Comments
Keep comments free of racism, sexism, homophobia and abusive language. People's Assembly reserves the right to delete and edit comments
(For newest comments first please choose 'Newest' from the 'Sort by' dropdown below.)