According to the Statistics South Africa report on poverty trends for 2006 to 2015, the last five years between 2011 and 2015 have been a rough economic rollercoaster for South Africa driven by a combination of low economic growth, high unemployment levels, low commodity prices, higher consumer prices (especially for energy and food), lower investment levels, greater household dependency on credit, and policy uncertainty. This has seen the financial health of South African households decline under the weight of these economic pressures and, in turn, pulled more households and individuals down into poverty.
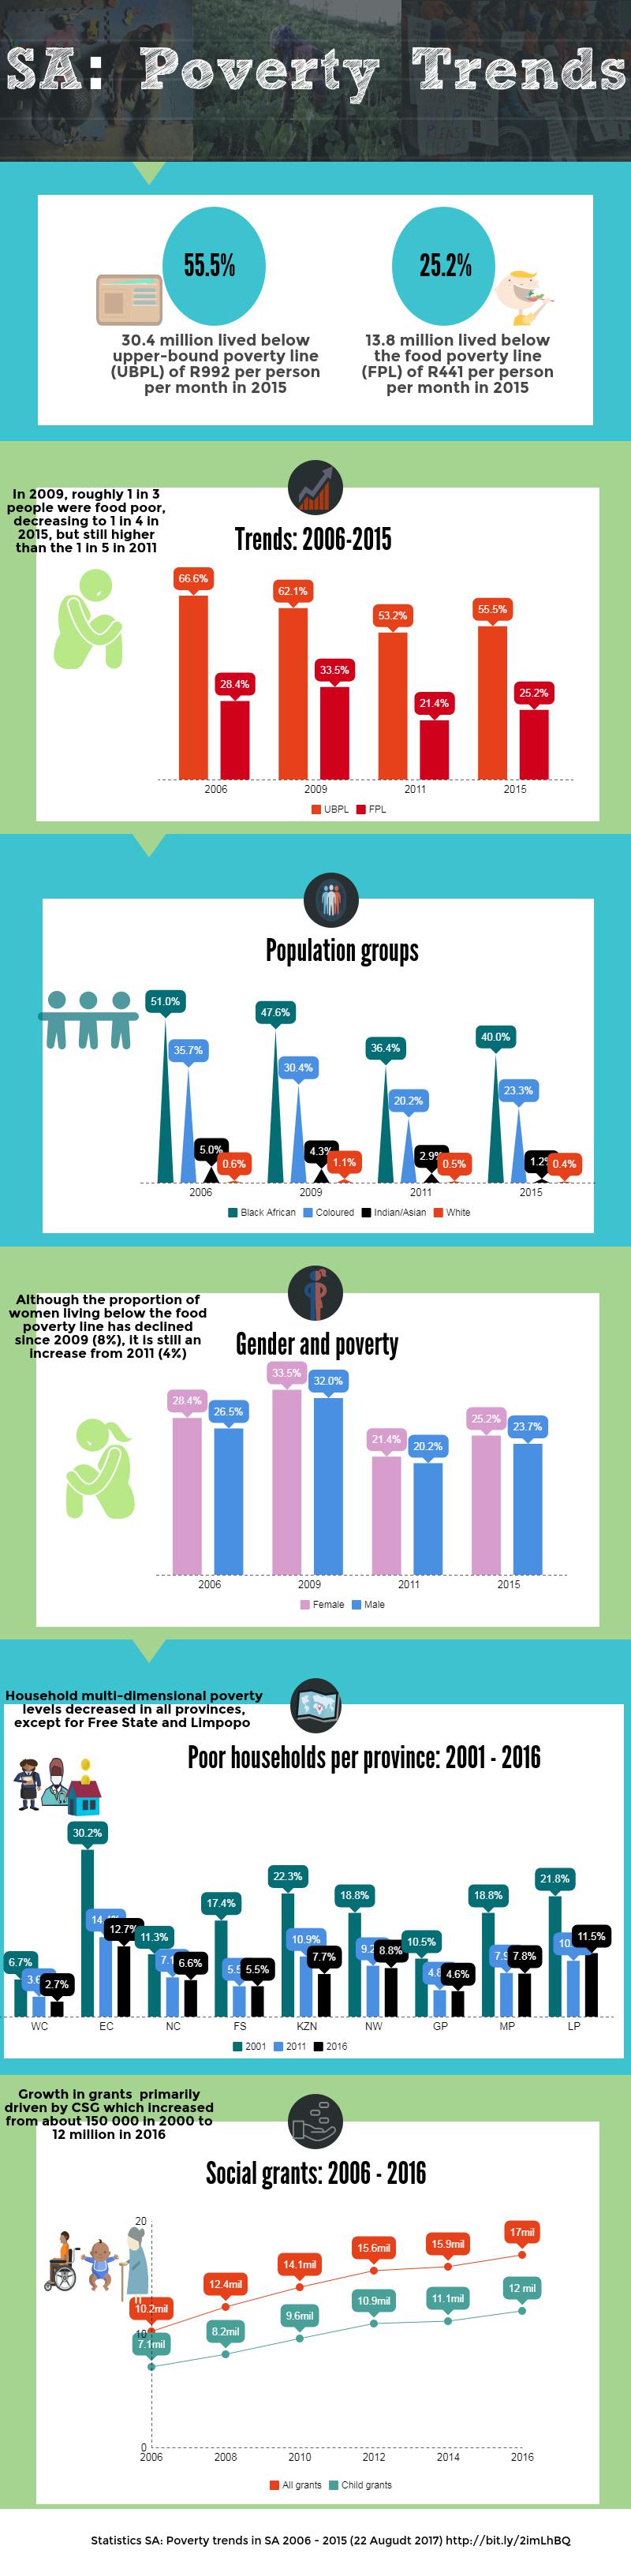
Despite the general decline in poverty between 2006 and 2011, poverty levels in South Africa rose again in 2015. When applying the upper-bound poverty line (R992 per person per month) in 2015, more than one out of every two South Africans were poor in 2015, with the poverty headcount increasing to 55,5% from a low of 53,2% in 2011. This means over 30,4 million South Africans living in poverty in 2015. Multi-dimensional poverty (in health, education and standard of living) has however decreased in most provinces.
Other noteworthy stats:
-
13.8 million South Africans lived below the food poverty line of R441 per person per month in 2015
-
Growth in grants has primarily been driven by the expansion of child support grants which increased from roughly 150 000 in 2000 to 12 million in 2016
-
In 2009, roughly 1 in 3 people were food poor, decreasing to 1 in 4 in 2015, but still higher than the 1 in 5 in 2011
-
Although the proportion of women living below the food poverty line has improved (8%) since 2009 until 2015, it is still deteriorated since 2011 by 4%
See infographic below for more:

Comments
Keep comments free of racism, sexism, homophobia and abusive language. People's Assembly reserves the right to delete and edit comments
(For newest comments first please choose 'Newest' from the 'Sort by' dropdown below.)