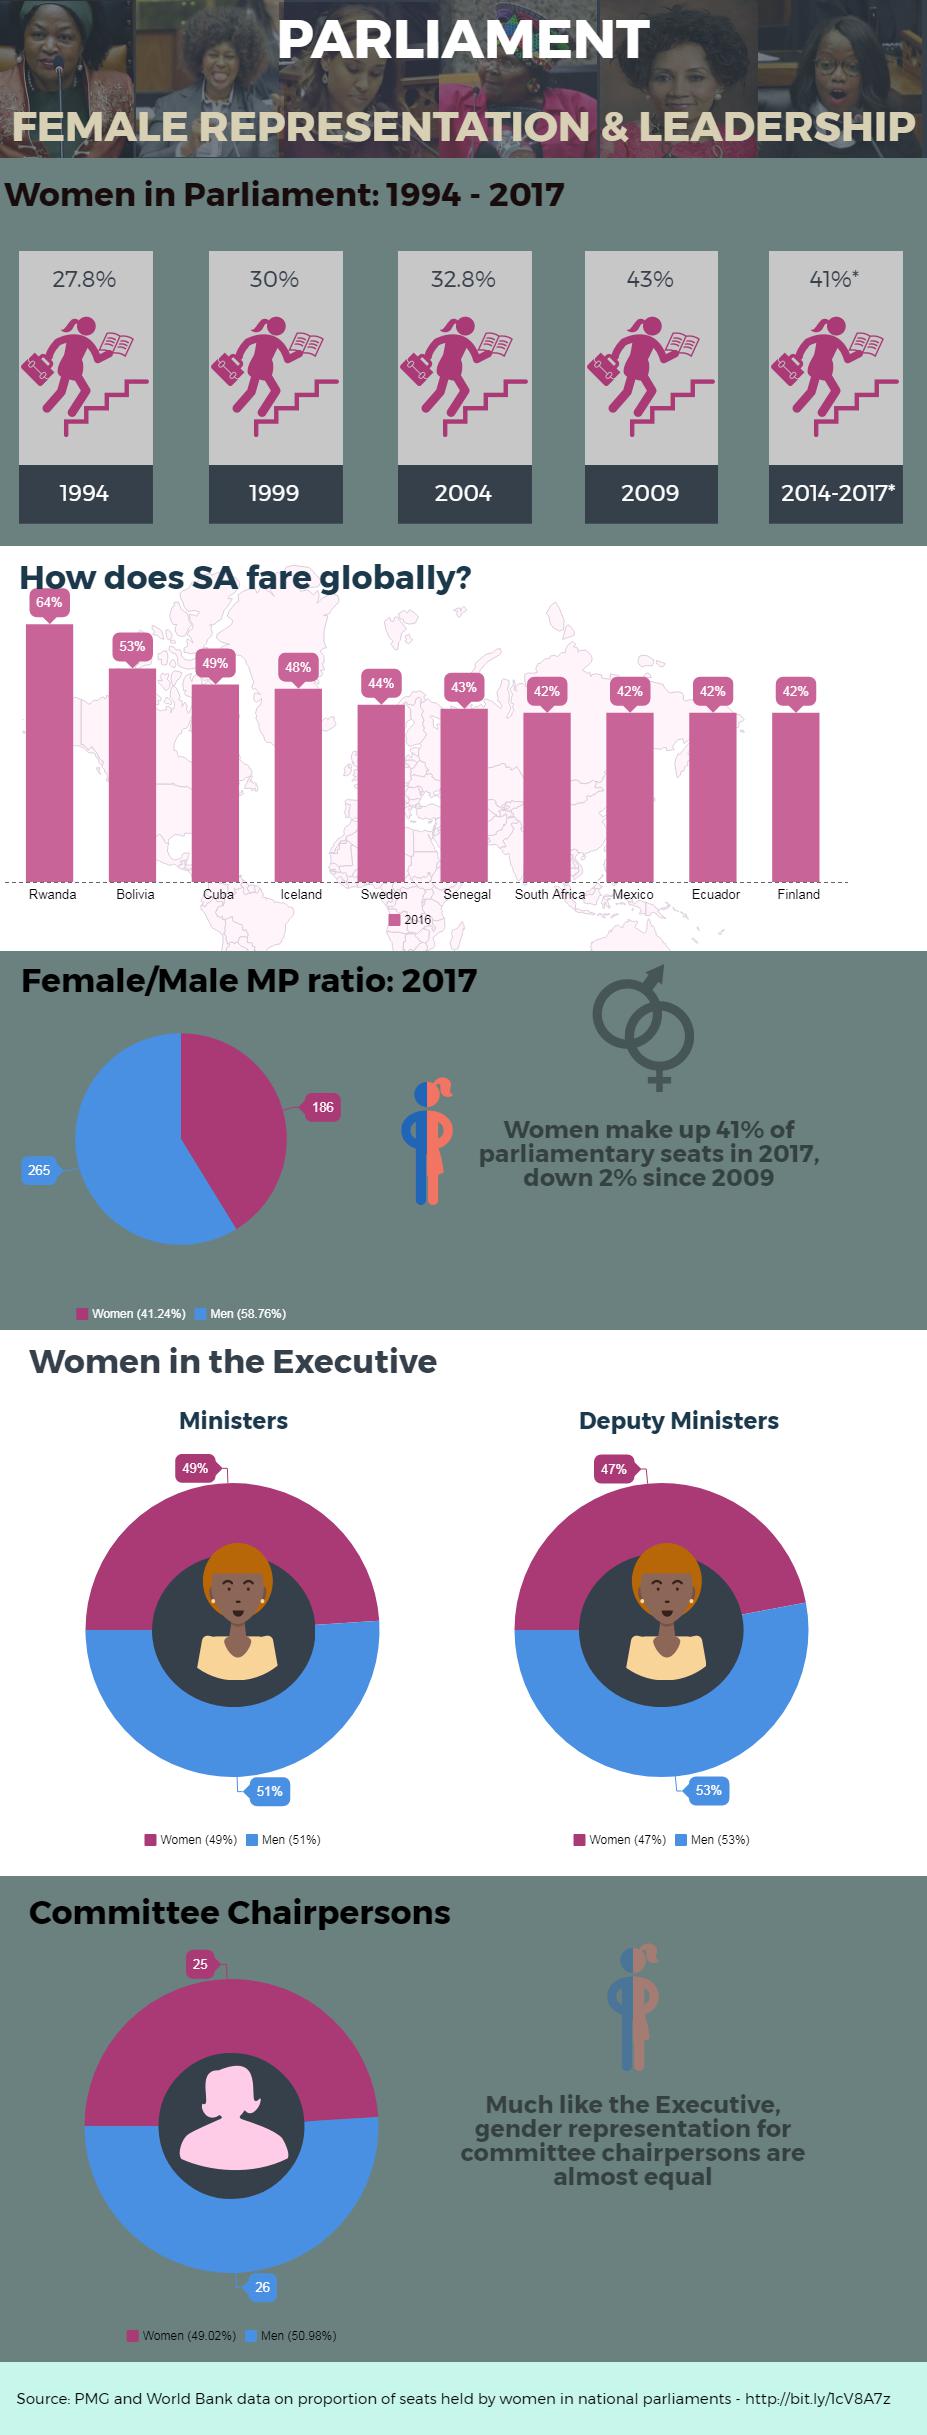
Prior to the South African democracy, female representation in Parliament sat at just 2.7% and rose to about 28% by the time the Constitution was adopted. By 2009, parliamentary seats occupied by women rose to an all-time high of 43% and currently stands at 41%.
Globally, data by the World Bank in 2016 placed South Africa (42%) in joint 7th place with Mexico, Ecuador and Finland based on the proportion of seats held by women in national parliaments; with Rwanda taking first place with 64%. It is worth noting though that unlike Rwanda the South African Constitution does not detail a formal quota for either of the parliamentary houses.
Leadership positions in politics were previously dominated by men, and women’s entry into the sphere has been lauded as a success story. Female representation at executive level (Ministers and Deputy Ministers), and as committee chairpersons are almost level.
See infographic for more:

Comments
Keep comments free of racism, sexism, homophobia and abusive language. People's Assembly reserves the right to delete and edit comments
(For newest comments first please choose 'Newest' from the 'Sort by' dropdown below.)