The Quarterly Labour Force Survey (QLFS) is a household-based sample survey conducted by Statistics South Africa (Stats SA). It collects data on the labour market activities of individuals aged 15 years and above who live in South Africa. The QLFS for the First Quarter (Q1) of 2016 was first released on 9 May 2016.
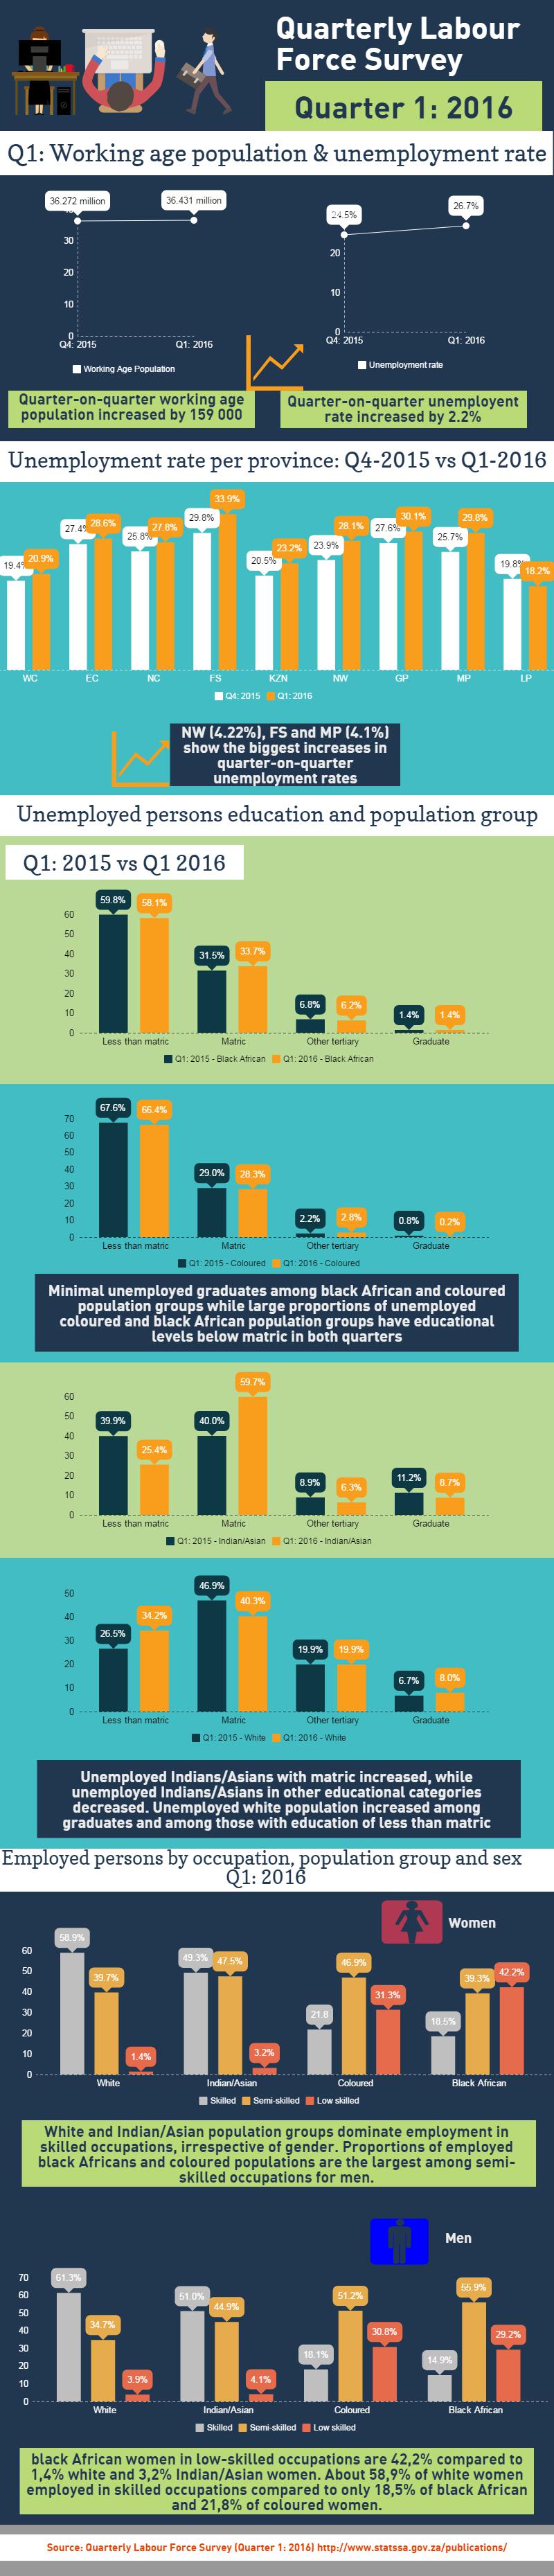
According to Stats SA, the results for the first three months of 2016 show that the working-age population increased by 159 000 to 36.4 million since December 2015. This resulted in an increased unemployment rate (26.7%) for the first quarter, up 2.2%.
Interesting outcomes of the report show:
-
White and Indian/Asian population groups dominate employment in skilled occupations relative to the black African and coloured population groups, irrespective of gender
-
The proportions of employed black Africans and coloured populations are the largest among semi-skilled occupations for men
-
Black African women are more vulnerable in the labour market, with larger shares in low-skilled occupations. The share of black African women in low-skilled occupations was 42,2% compared to 1,4% of white and 3,2% of Indian/Asian women
It should also be noted that:
-
The share of unemployed graduates was minimal among black African and coloured population groups while a large proportion of unemployed coloured and black African population groups had educational levels of below matric in the first quarters of both 2015 and 2016
-
Between January 2015 and March 2016, the share of unemployed black African and coloured population groups had remained steady in all the educational categories
-
During this period, noticeable changes were observed among Indian/Asian and white populations. The share of unemployed Indians/Asians with matric had increased, while the unemployed Indians/Asians in other educational categories had decreased
-
The share of unemployed white population increased among graduates and among those with education of less than matric; and decreased among those with matric and other tertiary education
See infographic below for more:

Comments
Keep comments free of racism, sexism, homophobia and abusive language. People's Assembly reserves the right to delete and edit comments
(For newest comments first please choose 'Newest' from the 'Sort by' dropdown below.)