Gender activists around the country have been stewing this week since the ANC’s announcement of its almost all male selection of premiers as well as the DA’s mostly male cabinet. Whatever the reasons for these selections, these two events have put a spotlight on gender equality in the country. For many, it has raised the question: Are we at the point of gender reform and transformation that we need to be?
People’s Assembly has calculated the number of newly sworn in male and female Members of Parliament for the National Assembly and the National Council of Provinces, and we’ve also given you the gender breakdown per party.
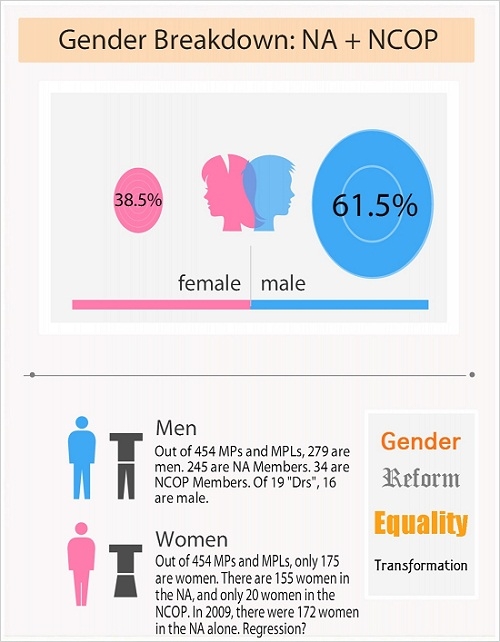
According to the South African National Census of 2011, women make up 51.3% of the country’s almost 52 million population. However, this does not seem to translate into seats in Parliament. Out of the 54 permanent delegates sworn in to the National Council of Provinces on Thursday, 22 May, only 20 are women. According to the data, there still seems to be an under-representation of women in Parliament. In 2009, statistics showed that women filled 43% of the NA seats. Now, in 2014, only 38.8% of the NA seats are filled by women.

Gender Breakdown for the NA and NCOP:

Breakdown Per Party: NA - ANC, DA and EFF

Breakdown Per Party: NCOP - ANC, DA and EFF

For a full list of NA Members, click here. For a full list of NCOP Members, click here.
Comments
Keep comments free of racism, sexism, homophobia and abusive language. People's Assembly reserves the right to delete and edit comments
(For newest comments first please choose 'Newest' from the 'Sort by' dropdown below.)